Benchmarking Supply Chain KPIs: A Guide

Benchmarking supply chain KPIs helps businesses measure performance, identify inefficiencies, and improve processes. This guide covers key metrics like OTIF, Inventory Turnover, and Cash-to-Cash Cycle, explains benchmarking methods, and highlights tools like AI-powered platforms for tracking and improving supply chain performance.
Supply chain KPIs are critical for evaluating efficiency and effectiveness, from procurement to delivery. Metrics like On-Time In-Full (OTIF), Perfect Order Rate, and Inventory Turnover Ratio provide actionable insights when tied to specific goals. Benchmarking adds context by comparing performance against historical data, internal departments, or industry standards.
Key steps:
- Identify relevant KPIs that impact profits and customer satisfaction.
- Organize KPIs by function (e.g., delivery, inventory, supplier reliability).
- Set targets using historical and industry data.
- Use tools like ERP systems and AI platforms for real-time tracking.
- Regularly review progress and adjust benchmarks to drive improvement.
KPIs V. Benchmarking and How to Use them Together
sbb-itb-b077dd9
Identifying Key Supply Chain KPIs
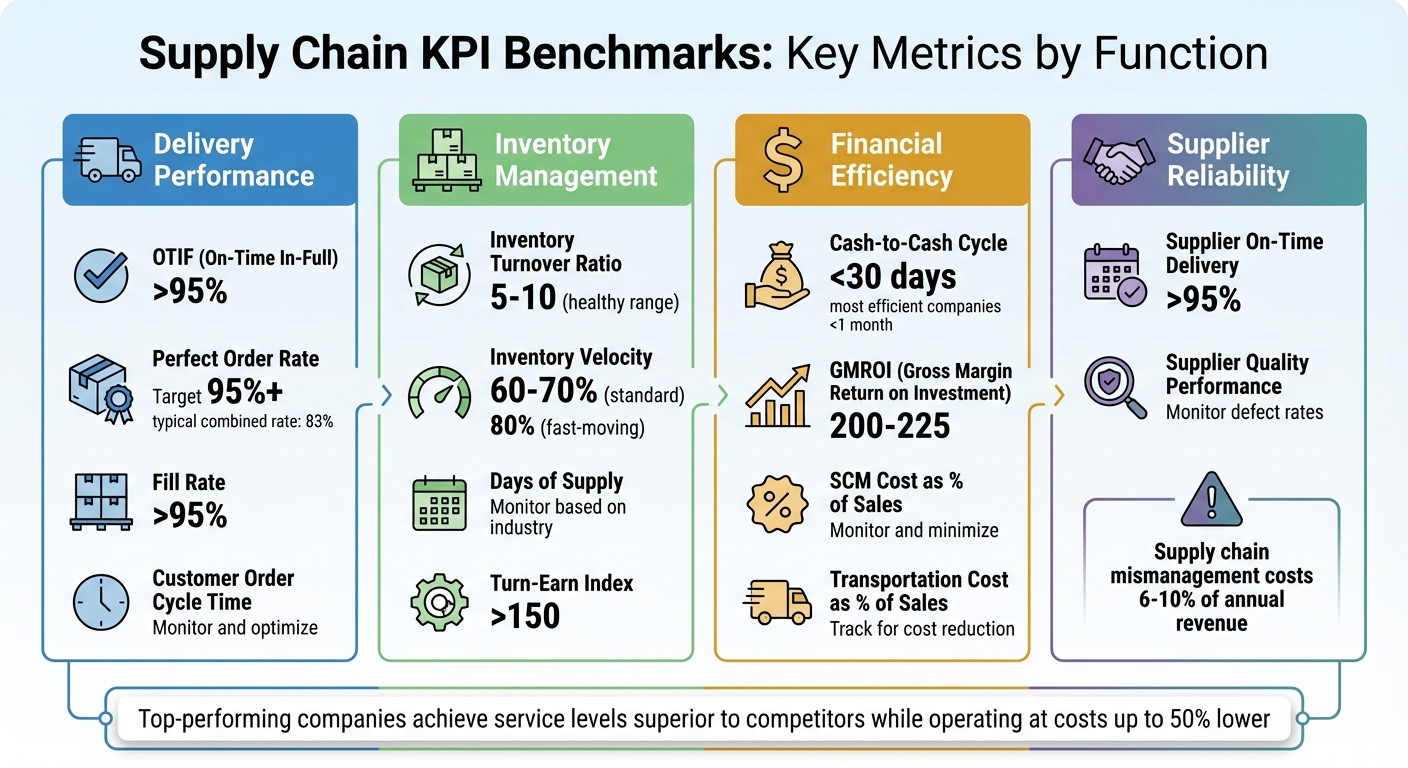
Supply Chain KPI Benchmarks and Target Ranges by Function
Focus on tracking KPIs that directly influence your profits and customer satisfaction. Start with the essentials and expand as needed.
Core KPIs to Track
On-Time In-Full (OTIF) is one of the most critical supply chain metrics. It measures the percentage of orders delivered in the correct quantity and within the agreed timeframe. As noted by FourKites:
"Getting your OTIF metric right is often considered the most important KPI for supply chain efficiency".
This metric reflects both speed and accuracy - two qualities that matter most to customers.
The Perfect Order Rate measures how often orders are completed without errors. This includes accurate recording, timely shipping, correct quantities, and no damage. While individual metrics might seem strong - such as 92% on-time, 95% in-full, 97% damage-free, and 98% accurate documentation - the combined Perfect Order Rate can drop to 83%. This calculation highlights gaps that isolated metrics might miss.
Inventory Turnover Ratio (ITR) tracks how often your inventory is sold and replenished over a set period. A healthy range typically falls between 5 and 10.
Cash-to-Cash (C2C) Cycle Time measures the days between paying suppliers and receiving payments from customers. Abby Jenkins, Product Marketing Manager at NetSuite, explains:
"The most efficient companies have cash-to-cash cycle times of less than one month".
This metric directly affects your working capital and financial flexibility.
Supplier On-Time Delivery monitors the reliability of your suppliers by tracking the percentage of products delivered within agreed timelines. Supply chain mismanagement can cost companies between 6% and 10% of their annual revenue, making this metric crucial for avoiding disruptions.
Organizing KPIs by Function
Categorizing KPIs by function helps streamline decision-making. For example, delivery-focused metrics like OTIF, Perfect Order Rate, and Fill Rate measure customer-facing reliability. Inventory-focused KPIs such as Inventory Turnover, Days of Supply, and Inventory Velocity optimize stock levels and capital use. Supplier reliability metrics assess upstream risks, while financial efficiency indicators like Cash-to-Cash Cycle, GMROI, and SCM Cost as % of Sales evaluate cost management.
| Functional Category | Key KPIs | What It Measures |
|---|---|---|
| Delivery Performance | OTIF, Perfect Order Rate, Fill Rate | Customer satisfaction and service quality |
| Inventory Management | Inventory Turnover, Days of Supply, Inventory Velocity | Stock levels and capital efficiency |
| Supplier Reliability | Supplier On-Time Delivery, Supplier Quality Performance | Supplier performance and risk management |
| Financial Efficiency | Cash-to-Cash Cycle, GMROI, SCM Cost as % of Sales | Cost-effectiveness and working capital |
This approach avoids "paralysis by analysis" by focusing on 5 to 6 key metrics for high-level dashboards. Secondary metrics can be reviewed periodically without overwhelming daily operations.
Aligning KPIs with Business Goals
Once KPIs are organized, align them with your strategic goals to ensure they drive meaningful outcomes. For instance, if your strategy focuses on cost reduction, prioritize metrics like Transportation Cost as % of Sales. If you aim to enhance value, focus on service-oriented metrics like Customer Order Cycle Time.
It’s essential to track metrics your teams can influence. As Rob O'Byrne, Supply Chain Consultant, puts it:
"Speed without accuracy is just chaos moving faster".
Balancing metrics that might conflict, such as picking speed versus accuracy, is key to avoiding inefficiencies.
Companies that excel in supply chain performance often achieve service levels superior to competitors while operating at costs up to 50% lower. Their secret? They track KPIs tailored to their customer needs instead of chasing generic benchmarks. The goal is to monitor what matters most to your specific objectives.
Tools like Leverage AI (https://tryleverage.ai) simplify this process by integrating with ERP systems to track supplier performance, delivery timelines, and other KPIs in real time, ensuring alignment with your business goals.
Setting Benchmarks and Standards
Using Historical and Industry Data
To set meaningful benchmarks, start by examining your current performance. For instance, if your order fill rate is 90%, aiming for 95% is reasonable - but jumping straight to 99% might overwhelm your team and lead to setbacks.
Historical data is a great starting point since it's already available in your ERP and management systems. Pull reports from these systems - whether for your warehouse, transportation, or overall operations - and analyze performance trends over the last 12 to 24 months. You might notice patterns, like peak performance during certain months or seasonal slowdowns that require extra attention.
Next, compare your baseline to industry benchmarks. Organizations like APQC offer median KPI values for sectors such as aerospace, automotive, pharmaceutical, and retail. The SCOR (Supply Chain Operational Reference) model provides over 150 standardized metrics across categories like Plan, Source, Make, and Deliver, making it easier to conduct fair comparisons. For example, an American agricultural and chemicals company saved $150 million in inventory costs by identifying performance gaps through benchmarking.
By blending historical data with industry benchmarks, you’ll gain a clearer understanding of what’s achievable with your current resources and where improvements are possible. This combined approach lays the groundwork for setting specific, actionable targets.
Defining Target Ranges for KPIs
Clear target ranges help your team know what success looks like. Here are some industry-standard benchmarks to consider:
| KPI Metric | Recommended Target Range |
|---|---|
| Cash-to-Cash Cycle | Less than 30 days |
| GMROI | 200–225 |
| Turn-Earn Index | Greater than 150 |
| Inventory Velocity | 60%–70% (standard); 80% (fast-moving) |
| On-Time Delivery | Greater than 95% |
Adjust these ranges to match your operational scale. For instance, if your on-time delivery rate is currently 85%, aiming for 90% initially is more achievable than setting a goal of 95% right away.
A medical equipment manufacturer serves as a great example - they improved their forecast value add by 22% in just one year by setting realistic, incremental targets. To stay aligned with market changes and customer needs, review and adjust your targets quarterly.
Once your targets are in place, the next step is selecting the right benchmarking method to turn data into actionable insights.
Benchmarking Methods
Benchmarking methods help you measure and compare performance against your established targets. Here are four key approaches:
-
Historical Benchmarking
This method uses your past performance as a benchmark. Since the data is already in your systems, you can track progress over time, whether quarterly or annually. It's a great way to build momentum and showcase improvements. -
Internal Benchmarking
Compare different parts of your organization, such as departments, facilities, or product lines. For example, if your West Coast warehouse achieves 97% order accuracy while your East Coast facility is at 89%, you’ve pinpointed an area of excellence that others can emulate. -
External Benchmarking
Measure your performance against competitors or industry leaders. For instance, Xerox boosted its productivity growth rate to 10% annually - double its previous rate - by benchmarking against competitors. -
Gap Analysis
Identify gaps between your current performance and your goals. One leading CPG manufacturer used this method to save $22 million in inventory costs. By identifying misalignments between their supply chain technology and business processes, they prioritized improvements with the highest financial impact.
When benchmarking externally, keep in mind that operations vary widely. For instance, an automated warehouse will naturally have different cost structures and performance metrics than a manual one. Adjust for these differences to ensure your comparisons are meaningful.
Tools like Leverage AI (https://tryleverage.ai) can simplify this process by integrating with your ERP systems. These tools track supplier performance and delivery timelines in real time, eliminating the need for manual reporting and making it easier to apply any of the four benchmarking methods.
Tracking and Measuring KPIs
Once you've established benchmarks and standards, the next step is to track and measure your KPIs. This process provides the real-time insights necessary to make informed decisions and drive improvements.
Choosing Tools for KPI Measurement
Your ERP system is a great starting point for tracking KPIs. Tools like NetSuite and SAP APO centralize data collection, offering a "single source of truth" for key metrics such as inventory turnover and cash-to-cash cycle times. By consolidating data, these platforms eliminate the need for manual spreadsheets and reduce guesswork.
Cloud-based supply chain management platforms take this a step further by aggregating data from various sources - like outbound shipments, inventory levels, and carrier updates - into one unified view. This automation allows your team to focus on interpreting insights rather than spending time compiling reports.
AI-powered tools add another layer of efficiency. They turn static dashboards into predictive systems, offering features like lead-time forecasting and automated alerts whenever suppliers fall behind schedule. For instance, Leverage AI (https://tryleverage.ai) integrates directly with your ERP system to monitor supplier performance in real time. It automatically generates scorecards, highlighting which vendors meet delivery deadlines consistently and which require follow-up. This real-time visibility helps you address potential delays before they disrupt production.
The digital supply chain market is growing rapidly, with projections showing an increase from $4.1 billion in 2021 to $13.5 billion by 2027 - a compound annual growth rate of 12.8%. Companies adopting these tools are seeing tangible benefits, including cost reductions of up to 20% and customer service improvements of up to 30%.
But selecting the right tools is just the beginning. Accurate and consistent data collection is equally important.
Data Collection Frequency and Accuracy
When it comes to collecting KPI data, consistency is more important than perfection. Set a regular schedule - weekly for operational metrics like order fill rates, or monthly for financial KPIs like cash-to-cash cycle time. This approach allows you to track trends over time and make data-driven decisions.
Automated data collection can minimize errors and provide real-time updates. For example, integrating your warehouse management system or transportation platform with your tracking dashboard ensures that data flows seamlessly without manual input.
Real-time tracking has become a necessity. API integrations with carriers and IoT sensors now provide live shipment updates - essential during events like port slowdowns or severe weather. Including live tracking as a standard in your Service Level Agreements with carriers can close visibility gaps and improve overall reliability.
Another factor in data accuracy is breaking down silos. When procurement and warehouse teams use different systems, reconciling data becomes a challenge. Unified platforms that connect these systems ensure consistent calculations for metrics like "Supply Chain Costs as a Percentage of Sales" across all departments.
With accurate, real-time data streams in place, dashboards can transform raw numbers into actionable insights.
Visualizing KPI Metrics
Interactive dashboards are key to making sense of your data. They allow you to quickly identify trends and address critical issues without sifting through endless spreadsheets.
Modern dashboards go beyond simple charts. They can highlight predicted disruptions and estimate their financial impact, helping you prioritize effectively. For example, a dashboard might alert you to a supplier delay and calculate the potential revenue loss from production setbacks.
A great example of this in action is from 2024, when Richard Atkins, General Manager of Procurement at Bega, implemented a Supply Chain Performance Measurement Dashboard. This tool brought together cost, quality, service, and ESG KPIs into a single view, enabling the company to assess category performance and communicate results effectively to stakeholders.
"Leading companies have transformed operational KPIs from passive dashboards to AI-powered signals that inform and sometimes automate decisions." - Bridgenext Think Tank
To maximize usability, dashboards should be tailored to different audiences. Executives benefit from high-level summaries showing overall performance against targets, while warehouse managers need detailed views of daily metrics like picking accuracy and order cycle times. Customizing dashboards ensures that each team member gets the insights they need without being overwhelmed by unnecessary data.
Closing Performance Gaps and Driving Improvements
Once you've tracked and visualized your KPIs, the next step is turning those insights into actionable improvements. The real power of benchmarking lies in identifying gaps and using that knowledge to make meaningful changes in your supply chain.
Analyzing Benchmarking Results
First, dig into the numbers to understand their context. The SCOR (Supply Chain Operations Reference) model organizes over 150 metrics into a hierarchy, helping you zero in on problem areas. These metrics are grouped into five key categories: reliability, responsiveness, agility (focused on customers), and cost and assets (focused internally).
Start by evaluating internal performance to identify practices that can be applied across different units. Be cautious when comparing operations with vastly different setups - like an automated warehouse versus a manual one - as the results won't be directly comparable. Also, consider how metrics influence one another. For instance, slashing costs without care might harm service levels, so understanding these trade-offs is crucial.
"Benchmarking isn't going to fix your supply chain problems on its own. What it does is show you where the gaps are and give you a realistic target to aim for."
- Rob O'Byrne, Founder, Logistics Bureau
Focus on three to five KPIs that align with your strategic goals. For example, a medical equipment manufacturer boosted its forecast value add by 22% in a year by improving planning maturity and using targeted benchmarking. To uncover the root causes behind performance gaps, employ tools like the "5 Whys" or Fishbone diagrams. This analysis sets the stage for the improvement strategies discussed next.
Implementing Improvement Strategies
Once you've identified the gaps and their causes, set SMART goals (specific, measurable, achievable, relevant, and time-bound). For instance, aim to reduce lead time by 20% within six months. Success stories show the potential: a global retailer cut inventory costs by 20% by adopting best-in-class demand forecasting practices, while a logistics company shaved 25% off its delivery times through a thorough benchmarking process.
Collaborate with suppliers to tackle issues. If delays from suppliers are driving costs up, consider automating routine follow-ups. Tools like Leverage AI can integrate with your ERP system to track purchase orders, send automated reminders, and generate performance scorecards - allowing your team to focus on strategic tasks.
For inventory planning, AI-powered forecasting can make a huge difference. By analyzing historical data, seasonality, and market trends, you can reduce guesswork. One American agricultural and chemicals company saved $150 million in inventory costs by improving risk management and planning.
Employee involvement is key during these transitions. As David Widder, Senior Director of Supply Chain Planning at Mallinckrodt Pharmaceuticals, put it:
"We are more aligned as a business team than we've ever been. I am confident in our ability to meet any challenge."
Look for opportunities to automate routine tasks so your team can focus on strategic decisions. As improvements take shape, monitoring progress becomes essential to keep the momentum going.
Monitoring Progress Over Time
Benchmarking isn’t a one-and-done activity - it’s a cycle: benchmark, compare, improve, and re-benchmark. Regular reviews, such as quarterly updates, give teams enough time to implement changes and measure their impact without losing focus. Define KPIs for each initiative and track them consistently.
Use a mix of functional metrics for daily operations, end-to-end metrics like the cash-to-cash cycle, and executive dashboards for a big-picture view.
"Measuring performance is a critical part of closing the feedback loop for fine-tuning any business's supply chain operation in the long run."
- Navneet Lekshminarayanan, CEO, Holocene
Business Intelligence tools like Tableau or Power BI can help visualize trends and make data more accessible for decision-makers. Make benchmarking and monitoring a standard part of your operations rather than treating them as one-off projects. When it becomes routine, you’ll catch problems early and maintain steady progress. Celebrating milestone achievements can also keep teams motivated.
The goal is to keep improving. Each benchmarking cycle should uncover new opportunities, helping you refine your approach and build a supply chain that’s ready to handle future challenges.
Conclusion and Key Takeaways
Recap of the Benchmarking Process
Benchmarking supply chain KPIs starts with identifying critical metrics, setting achievable benchmarks based on historical and industry data, measuring performance, and focusing on targeted improvements. The SCOR framework simplifies this by organizing over 150 metrics into standardized categories, offering a universal way to assess and compare performance both internally and against industry standards. Keeping this process alive through regular evaluation and updates ensures continuous progress. This structured approach lays the groundwork for meaningful operational gains.
Benefits of Benchmarking for Supply Chain Management
When done right, benchmarking delivers measurable results. Companies using structured benchmarking have reported savings of up to $800 million. Real-world examples highlight its impact: a global retailer cut inventory costs by 20% with improved demand forecasting, while a logistics firm reduced delivery times by 25% through focused benchmarking efforts. These practices also lead to a 25% drop in inventory levels and a 95% boost in on-time delivery rates. By removing biases and identifying inefficiencies, benchmarking provides clear, actionable data that fosters collaboration and drives results.
Final Thoughts
Supply chains are evolving with AI-driven analytics, real-time tracking, and a focus on continuous improvement. Companies that embed benchmarking into their quarterly routines build stronger, more adaptable supply chains while boosting profitability. The key is to focus on the KPIs that align directly with your strategic goals.
AI tools like Leverage AI make this easier by automating tasks such as supplier follow-ups, real-time purchase order tracking, and performance tracking. These tools free up teams to concentrate on strategic initiatives. As David Schorlemer, CFO of ProPetro Services, wisely noted:
"Our industry can't rely on a significant increase in activity next year to drive earnings growth. We must think about how we minimize spend to deliver improved earnings in a low-to-no growth environment."
Benchmarking, when powered by data and AI, provides a clear roadmap for achieving these goals. By integrating these practices into your operations, you build a culture of continuous improvement that’s essential for long-term success in supply chain management.
FAQs
Which supply chain KPIs should I benchmark first?
To get a clear picture of how well your operations are running and how satisfied your customers are, focus on key performance indicators (KPIs) that highlight both. Metrics like on-time delivery, order cycle time, inventory turnover, and transportation accuracy are essential. These directly affect your service quality and cost management.
Additionally, monitoring the perfect order rate and days of inventory on hand can reveal bottlenecks and pinpoint inventory challenges. By concentrating on these core metrics, you’ll build a strong base for improving processes and making smarter strategic decisions.
How do I set realistic KPI targets for my business?
To set practical KPI targets, start by comparing your current performance to industry norms. This helps you pinpoint goals that are both realistic and aligned with your business objectives. Make sure the KPIs you choose are measurable so you can track progress accurately. It's also important to review and adjust these targets regularly, using performance data and keeping an eye on market trends. Tools like those from Leverage AI can assist by offering real-time insights and automation, making it easier to fine-tune your targets as needed.
How can I automate KPI tracking with my ERP using Leverage AI?
Leverage AI works seamlessly with your ERP system to automate the tracking of key performance indicators (KPIs) using real-time data. It simplifies processes such as supplier follow-ups, data reconciliation, and performance reporting. With customizable dashboards, you can monitor metrics like delivery times, defect rates, and costs - all in one place. This automation not only enhances visibility but also minimizes errors and allows for proactive management of supplier performance, all directly from your ERP platform.